A first look at the numbers!
The detailed results are finally out, so after a thorough analysis of the turnout and other general numbers, I arrived to these conclusions. Unfortunately, before going into the analysis, it is important to note that I discovered two errors in the documents published on the official website (one added 62,000 and the other added 315,000 to number of registered, heavily skewing the turnout). I tried to correct them to the best of my ability. You can find more details about these errors in here. Fortunately, these errors are limited to the registered numbers, and do NOT affect the results. However, the fact that there are two errors might indicate that there are more…
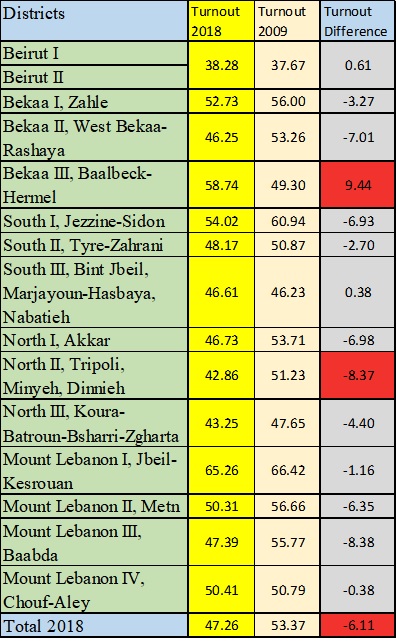
First, the ‘official’ turnout number of 49.2% announced by the Ministry of Interior on Monday May 7, is not exact.*
The turnout number of the 2018 election is 48.02% (1,861,203 voted out of 3,875,981) There is a 5.35 % drop in Turnout between 2018 and the 2009 elections. Most of the districts saw a drop. The only district that showed an improvement in turnout was the Bekaa III (Baalbeck – Hermel), with an impressive 9.44% improvement. Meanwhile, another four direct held almost the same turnout between 2009 and 2018 Mount Lebanon IV (Chouf Aley) with -0.38 , South III with +0.38, Beirut (as the districting of Beirut changed between the elections, I had to make a combined turnout for both Beirut I and II) with +0.61%, and Mount Lebanon I (Jebeil Kesrouan) with -1.16.
Concerning, the blank and invalid ballots percentages, there was a similar trend for the blank ballots with 0.81% in 2018 compared to 0.68% in 2009. It is worthy to note that in three districts the blank ballots rose above the average reaching more than 1%, in South I (Saida and Jezzine), South II (Tyre – Zahrani), and North II (Tripoli, Minyeh, Dinnieh). In South II, the rate is understandable as there was only two competing lists, and many felt that neither represented them. So is the South I rate, where the field was highly politicized, but with no civil society list presents. However, for North II, it is a point that I will tackle after talking about the invalid votes.
As expected, there was a large increase in invalid ballots, due to the introduction of a new proportional electoral system. The rate of invalid ballots jumped almost 300% from 0.61% in 2009 to 2.09% in 2018!! In a district by district comparison the higher trend was similar in most, with the exception of the North II (Tripoli, Minyeh, Dinnieh) district that had 3.52% of invalid ballots, a full percentage point above all other districts!!
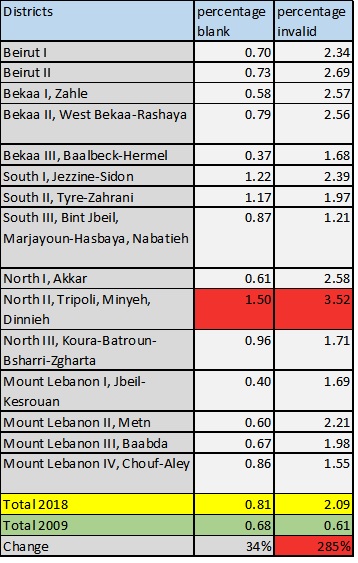
Both in blank and invalid ballots North II district is above average, in a statistically significant way. It would be interesting to keep an eye on this district, with all the judicial procedures being made. This district, has a history of having slightly above average Blank and invalid ballots, but that alone does not explain these big numbers. Indeed, in 2009 Tripoli was at 1.15% for invalid compared to a national average of 0.61%, and 1.14% in blank ballots for an average of 0.68%. However, it was not the district with the highest number, and was fairly in line the overall curve.
*All conclusions and numbers in this analysis are based on the detailed results published by the Ministry of Interior on this website. If anyone is interested by the excel sheet with all the numbers extracted from the official PDF documents, you can find it here.